International Journal of Blood Research and Disorders
Tarasev et al. Int J Blood Res Disord 2019, 6:041Volume 6
1DOI: 10.23937/2469-5696/1410041
Volume 6 | Issue 1
Access
Original arTiCle
Impact of the Oscillating Bead Size and Shape on Induced Mechanical Stress on Red Blood Cells and Associated Hemolysis in Bead Milling
Michael Tarasev*, Marina Muchnik and Sumita Chakraborty
Blaze Medical Devices, Ann Arbor, MI, USA
*Corresponding author: Michael Tarasev, Blaze Medical Devices, 540 Avis Dr., Ste. A, Ann Arbor, MI, 48108, USA, Tel: 734-883-4024

Abstract
Background: While in circulation, red blood cells (RBC) need to elastically undergo large deformations without lys-ing, an ability that may be compromised by cell membrane damage. Such can be tested in vitro by subjecting an RBC sample to external mechanical stress, e.g. through bead milling or oscillation of an object in a sample. In addition to controlling frequency and duration of oscillations, this ap-proach can be further tailored by bead selection/design.
Objective: This work studies effects of different beads in cre-ating qualitatively as well as quantitatively different shear stresses when oscillated in a sample containing RBC.
Methods: Identical, diluted RBC samples were stressed via bead milling using different beads, with hemolysis profiles developed in each case.
Results: Bead dimensions significantly impacted induced stress, both in magnitude as well as type, as reflected by hemolysis under respective conditions. Specifically, cell protection (from lysis) afforded by albumin (when present in the medium) showed a complex dependence on bead length and diameter, with the effect seemingly indicative of multiple combined stresses induced by the bead oscillation. The effect is described as an interplay of stresses generated in bead wake in combination with those generated in the annulus.
Conclusion: Bead oscillation based mechanical fragility (MF) profiling of RBC presents a useful tool for exploring effects of different shear stress types for various potential applications for assessment of blood damage, and particu-larly of sub-hemolytic red cell damage.
Keywords
Red blood cell(s), RBC, Erythrocyte, Mechanical fragility, Bead milling, Shear stress, Hemolysis
Introduction
While in circulation, red blood cells (RBC) need to elastically undergo large deformations while passing through the capillary network, without lysis (rupture), and even larger deformation when passing through spleen inter-endothelial slits. This ability is mediat-ed by the cell plasma membrane, the only structural element of RBC, which is composed of a lipid bilayer linked by transmembrane protein complexes (notably Band 3-ankyrin and 4.1R) to spectrin elastic network. It has been suggested that overall membrane cohesion may be determined by these bilayer-skeleton linkages, mainly by those mediated by Band 3. On the other hand, mechanical stability of the RBC membrane seems to be determined primarily by the proteins associated with 4.1R complex, with 4.1R protein and actin having the biggest influence, as well as by spectrin-spectrin. Mem-brane deformability, defined as the extent of stress-in-duced deformation of the cell membrane without lysis, and membrane stability, defined in that case as the maximum extent of deformation before the cell fails to recover its shape, were shown to depend on different membrane skeletal protein interactions, and thus can change without a fixed relationship to each other (upon RBC membrane perturbations) [1].
External mechanical stress can potentially induce different types of deformation in the RBC membrane, including compression-stretching (associated with changes in membrane area), bending (and/or torsion-al) deformations, and shear deformations that do not affect changes in RBC surface area (which would not

Citation: Tarasev M, Muchnik M, Chakraborty S (2019) Impact of the Oscillating Bead Size and Shape on Induced Mechanical Stress on Red Blood Cells and Associated Hemolysis in Bead Milling. Int J Blood Res Disord 6:041. doi.org/10.23937/2469-5696/1410041
Accepted: June 25, 2019: Published: June 27, 2019
Copyright: © 2019 Tarasev M, et al. This is an open-access article distributed under the terms of the Creative Commons Attribution License, which permits unrestricted use, distribution, and reproduction in any medium, provided the original author and source are credited.
necessarily preclude local perturbations of the spectrin network, associated for example with redistribution of anchor protein complexes).
Such perturbations, manifested as changes to mem-brane components, can result in reduced mechanical stability of RBC. That, in turn, leads to accelerated cell fragmentation and hemolysis, which, besides anemia, was implicated in a cascade of detrimental events as-sociated with the release of hemoglobin (e.g. [2]). Mem -brane modifications can also arise through various pathologies and diseases, blood storage, or the action of drugs or blood-contacting devices. While RBC may exhibit high apparent tolerance to fluidic shear stress-es, cells can be altered even when such stress does not reach the hemolytic threshold. Such “sub-hemolytic” damage may lead to later hemolysis in circulation, in addition to any other potential impairment of cell func-tion. etc.
The membrane property of mechanical fragility (MF) defines cells’ ability to withstand applied mechanical stress without rupturing (lysing), and is dependent on a variety of cellular attributes, including, among others, intracellular viscosity, membrane viscoelasticity and in-teraction of lipid bi-layer with cytoskeleton [3] - prop-erties that are not necessarily uniformly affected by external stress. It is considered to be a sensitive indi-cator of sub-hemolytic RBC damage - blood trauma not resulting in direct or overt hemolysis, but nevertheless leading to a shortened RBC life span in circulation [4]. One approach to measure MF is a rocker-bead test that involves slow rocking of a blood vial containing a stain-less steel ball (bead) for a predetermined time [5]. An-other approach involves 20-50 Hz oscillations of a stain-less-steel ball, with the development of a MF profile, reflecting observed levels of induced hemolysis (e.g., from zero to a hundred percent) over the total duration of oscillations [6].
It had been demonstrated previously that for a sphere/ball, hemolysis is caused predominantly by wake tur-bulence, with presumably ball speed (related to os-cillation frequency) and viscosity affecting the nature of turbulence in the medium [7]. Then, an additional ability to vary the type(s) of hemolysis-inducing stress was introduced, regarding when the spherical bead is replaced with a cylindrical bead design [8]. Such cylin-drical beads, oriented longitudinally in a tubular con-tainer, can introduce annular flows, with the length of the annulus depending on the bead’s length, and the gap thickness depending on the relative diameters of the bead and tube. That presents not only a potential-ly different flow type within the annulus itself, but also potentially much more cell interaction at the solid sur-face interface (bead annulus surface). Preliminary re-sults suggested that with cylindrical beads, in addition to effects of wake turbulence, induced hemolysis is also affected by two kinds of annular effects - tentatively associated with in-bulk and surface-related causes. It
was shown that changes in bead geometry could be used to vary relative contributions of different types of stress in the sample. That opens the possibility of being able to perturb different structural components of the RBC membrane to different respective and controlled extents, thus allowing more targeted probing of mem-brane response to mechanical stress and resultant he-molysis and sub-hemolytic RBC damage [8]. The present work aims to further expand the understanding of fac-tors influencing mechanically induced hemolysis of RBC when cylindrical beads are used to induce quantitatively and qualitatively different fluidic stresses, as well as to explore how such stresses’ relative proportions and/or interplay could potentially be used to probe membrane condition (perhaps sufficiently resembling, or at least reflecting, components of relevant physiological stress-es).
Materials and Methods
Blood components (packed RBC or pRBC, and Fresh Frozen Plasma or FFP) were obtained from American Red Cross Biomedical Services and stored according to AABB Standards [9]. Bovine Serum Albumin was pur-chased from Sigma-Aldrich (St. Louis, MO) and RPI Corp (Mt. Prospect, IL). Mechanical Fragility (MF) testing and profile development was performed using a vertical-ly oscillating bead in a sample and having incremental hemolysis being measured at respective stressing du-rations, as was described previously [7], except now using custom made cylindrical beads in addition to the standard spherical (ball) beads. Area Under the Curve (AUC), representing the area under the collected fragil-ity profile, is a profile-based value that was used here to evaluate induced hemolysis over a given aggregate stress duration. Bead speeds during oscillation were measured through analysis of video recordings of bead movement in the bead mill used in the experimental conditions. Records of bead movement were obtained using a high-speed camera (Casio Exilim HS, Casio, Ya-magata, Japan) used in 240-520FPS mode. Image analy-sis was performed by Tracker 4.92, an open source vid-eo analysis and modelling tool (Douglas Brown, 2016). Bead speed was calculated from the distance the bead travelled through the medium over a given time inter-val. Average bead speed is based on recordings of 3 to 5 seconds of bead movement. Data is presented in the form of sample mean and standard deviation (SD), the median, with 1.5 × IQR (interquartile range) where ap-propriate. One sample Student t-test or signed rank test with a two-tailed p-value of 0.05 was used to test for statistical significance. Fits shown on the figures are for illustration purposes only. Additional details regarding this section are provided in a Supplement.
Results
Role of bead length
Dependence of induced hemolysis on the length of
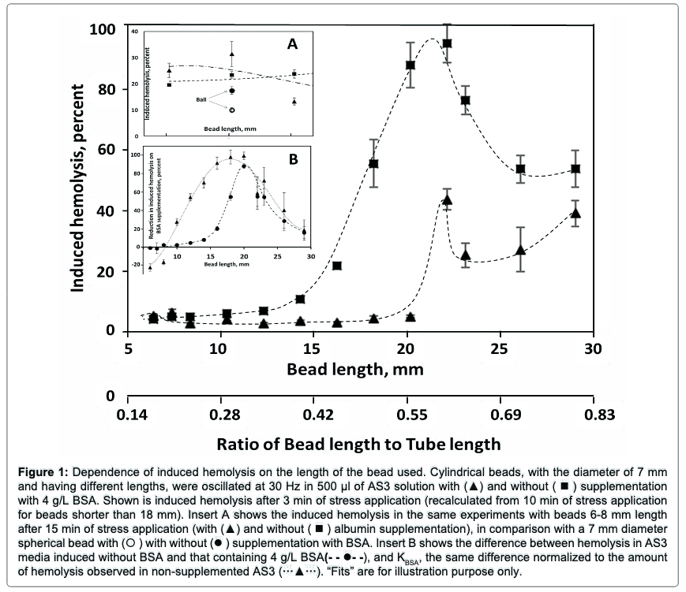
the bead in AS3 media, supplemented and not supple-mented with albumin (Figure 1), shows a maximum at about 22 mm, corresponding to about a 0.6 bead-length to tube-length ratio (RBL/TL). With a small cylindrical bead (7 mm in diameter, and 6 or 7 mm in length), unlike when a 7 mm sphere was used, albumin supplementation did not result in a decrease in induced hemolysis. A reverse effect, elevated hemolysis, was instead reproducibly observed (Figure 1, Insert A). For longer cylinders, medi-um supplementation with albumin did result in a sharp decline in observed hemolysis. The magnitude of this protective effect was maximal for beads of 20 mm in length (~ 0.55 RBL/TL; Figure 1, Insert B). When normal-ized to induced hemolysis observed in AS3 un-supple-mented media, the maximum effect remains at 18-20 mm bead length, although the dependency relationship becomes less sharp (not shown).
In the vertical bead mill employed for this work, it is the head of the mill, with the sample tubes inside, that is actually (directly) oscillated. Thus, the bead’s actual movement is determined by a combination including drag forces as the fluid medium around the bead shifts
in response to the tube’s oscillation, fluid resistance to bead movement, and gravity. The bead’s range of the movement is constrained by the top and the bottom of the tube. Shear stress arises due to displacement of the tube and the media therein relative to the bead, and thus the term “bead movement” in this context should be understood to encompass a bead’s displacement relative to the oscillating tube (within the oscillating tube holder), with “bead speed” - as an absolute value of bead velocity relative to the oscillating tube - thus representative of the speed of the medium’s movement relative to the bead. As all beads here are simple cylin-ders or a sphere, direction of the flow over the bead, and thus the direction of the bead travel (up or down), should not affect the resultant induced hemolysis. Thus, a scalar value of speed is presented, instead of velocity, which is a vector quantity.
When evaluated using a high-speed camera, bead movement was found to be markedly uneven over the course of oscillations (Figure 2). No significant bead “loitering” at one or the other end of the tube had been observed at any oscillating frequencies, although
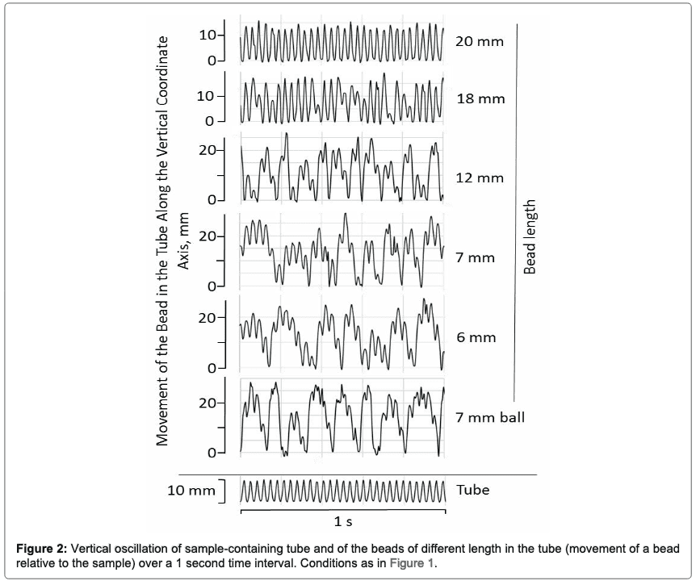
all beads, regardless of their length, reached both ends on the tube. While longer beads (over 18 mm in length) reached both ends at each oscillation, that was not the case for shorter beads, with very short beads (e.g. 6-7 mm cylindrical beads, or 7 mm ball, Figure 2) reaching the end of the tube only occasionally. For shorter beads, the overall movement appeared to occur with a low frequency oscillation (e.g. 7-8 Hz for a 6-7 mm cylindrical bead), overlaid with a higher frequency 30 Hz oscillations - same as the oscillation frequency of the bead mill, and thus of the sample tube. Similar effect was observed at other oscillation frequencies in the 20-50 Hz range. With increased bead length, the frequency of the low frequency component appeared to increase (12 mm bead, Figure 2); however, its overall contribution to the bead’s movement declined. Longer beads, relative to the tube length (20 mm in length and longer; RBL/TL ≥ 0.55), exhibited only the high frequency oscillation, that of the bead mill and the sample tube (20 mm bead, Figure 2). While variability in bead speed during bead milling was anticipated, as it is an inherent attribute of that method, the significant non-regularity in shorter bead movement was unexpected.
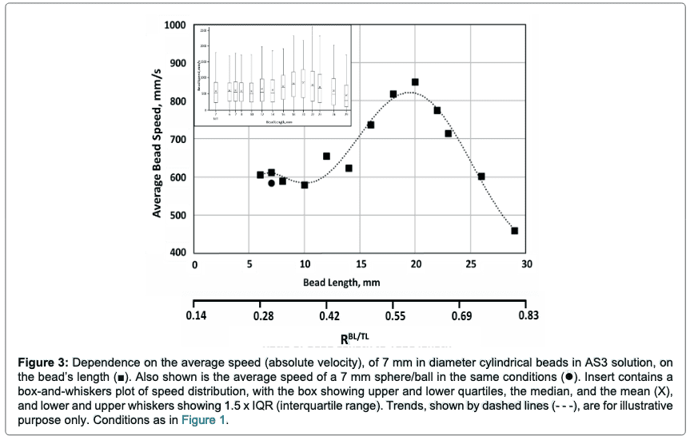
Dependence of average bead speed on bead length
is shown in Figure 3, with the box-and-whiskers plot of the speed distributions given in the insert. Notably, av-erage speeds and speed distributions were found to be similar for a ball and for cylindrical beads of a compa-rable size. Overall, on average, increased length up to about 20 mm (0.55-0.6 bead/tube length ratio), result-ed in faster bead movement, and after that threshold, bead speed declined. Supplementation with albumin resulted in an about a 20 percent decrease in average speed for beads 18-23 mm in length, with the difference declining for beads both longer and shorter, with essen-tially no difference observed for very short (6-8 mm in length) beads.
Role of bead diameter
Bead diameter was another factor affecting the magnitude of induced hemolysis (Figure 4). The depen-dence was complex, and at all oscillated frequencies used (from 20 to 50 Hz), in non-supplemented media, it exhibited an increase for bead diameters from 5.5 mm to 6 mm, corresponding to an increase in bead to tube diameter ratio (RBD/TD) from ab. 0.6 to ab. 0.7. That cor-responded to a small, but reproducible, increase in ob-served hemolysis. Similarly, at all frequencies, induced
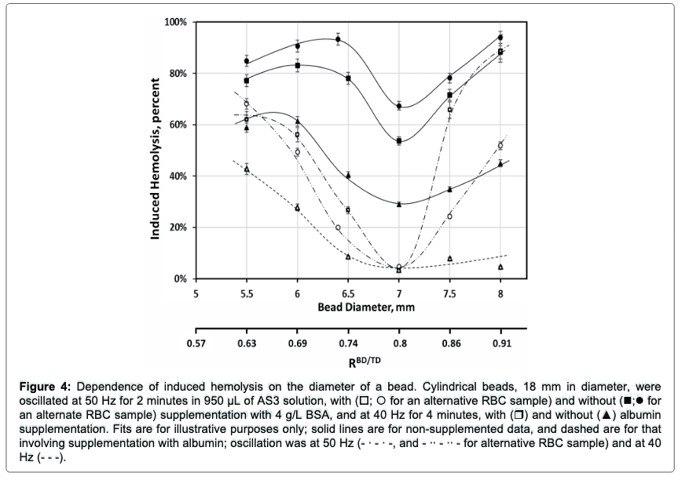
hemolysis was minimal for beads 7 mm in diameter (RBD/TD ≈ 0.8). Magnitudes of induced hemolysis rapidly increased for larger diameter beads (up to 8 mm, RB
TD ≈ 0.9). Such an increase was more pronounced at 50 Hz than at any of the lower frequencies (Figure 4; 40 Hz results are shown for comparison). Supplemen-
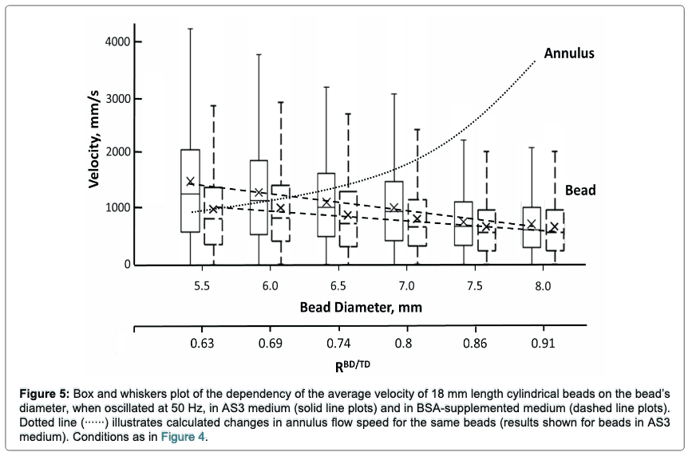
tation of media with albumin resulted in lessening of induced hemolysis, with the magnitude of such protec-tion also varying with bead diameter (Figure 5). This dependence was in general similar to that observed in non-supplemented media, particularly at lower oscilla-tion frequencies. At 50 Hz, the minimum (for induced hemolysis dependence, in the presence of albumin,on bead diameter) observed for 7 mm beads (RBD/TD ≈ 0.8) is sharper, and the increase in hemolysis when larger diameter beads are used is markedly more pronounced (Figure 4). As a result, at this frequency, for beads over 7 mm in diameter, supplementation with albumin pro-vided progressively smaller protection against induced hemolysis. Notably, the magnitude of these effects var-ied between different RBC samples, with some exhib-iting a larger impact of supplementation than others (Figure 4).
Progressively increased diameter of the bead result-ed in a linear decline in bead average speed, likely due to increasing resistance of the medium, which would be negatively correlated with the bead cross-section (Fig-ure 5). Such decline was observed in both albumin-sup-plemented and non-supplemented AS3 media.
Role of bead weight
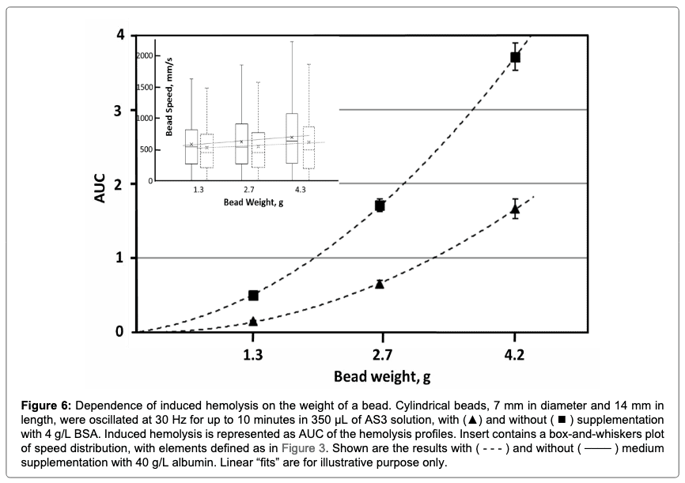
Bead weight was found to be a factor significantly af-fecting induced hemolysis (Figure 6), with the increased weight corresponding to higher hemolysis in both un-supplemented and supplemented-with-albumin media. In all cases, higher weights were also associated
Twith higher average bead speeds (Figure 6).
Role of oscillation parameters
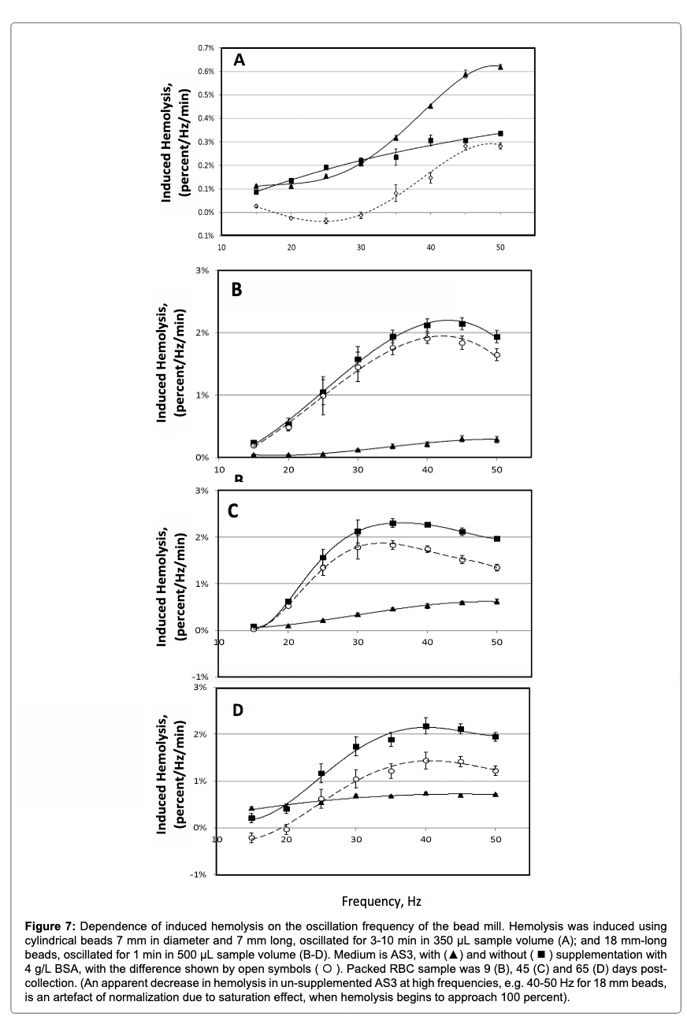
When bead oscillation is used to induce hemolysis, as can be expected, an increase in oscillation frequency results in increased hemolysis. In this case, oscillation frequency determines the periodicity of oscillations (e.g., as shown for 30 Hz frequency on Figure 2); how-ever, such periodicity is not the only factor determining the amount of induced hemolysis. Increase in oscillation frequency here is also associated with increased speed of the bead relative to the medium in the sample tube (data not shown), thus potentially affecting the intensi-ty of induced hemolysis. (Here, intensity of hemolysis is defined as the amount of hemolysis induced per oscil-lation. Figure 7 presents the intensity as hemolysis per 1 minute of stress application per 1 Hz, thus, for each frequency, showing average hemolysis resulting from 60 periods of oscillation). Figure 7 shows the intensity of hemolysis induced by 7 and 18 mm-long beads at fre-quencies from 15 to 50 Hz.
While movement of the 18 mm-long bead, at all fre-quencies, can be described as essentially oscillations from one end of the tube to the other end, the 7 mm bead, at each oscillation, traverses only a small distance through the tube, and thus through the medium, and with an overall movement that is much more erratic and complex than that for the longer beads. Despite this dif-ference, for both beads, increase in oscillation frequen-cy results in more pronounced protection against hemo-lysis (being afforded by albumin). In some cases, at low
frequencies, albumin supplementation not only failsto protect RBC against this type of mechanical stress, but even appears to be detrimental to RBC stability (here, resistance to lysis) under stress (Figure 7A and Figure 7C). While this effect was commonly observed when 7 mm-long beads were used, it was also observed with “expired” (over 42-days-old) stored pRBC. Figure 7A, Figure 7B and Figure 7C illustrate the changes observed in a given packed RBC sample when tested repeatedly at 9, 46, and 65 days post-collection. It should be not-ed that the magnitudes of those effects were not only affected by storage time, but also varied for blood sam-ples from different donors. In particular, some “fresh” (under 14 days in storage) packed RBC samples did not exhibit any statistically significant changes in induced hemolysis at low (15-20 Hz) oscillation using either 7 or 18 mm long beads upon supplementation with albumin. The reasons underlying this variability remain to be in-vestigated.
Discussion
As indicated, the specific means of stressing the RBC in MF testing can qualitatively affect the results. For example, it had been demonstrated that albumin sup-plementation of the medium can “protect” RBC against certain types of mechanical stress such as certain bead oscillation approaches [7,10], yet not with some alter-native methods (e.g., a jet/orifice system [11]). It was also found that, even within bead milling with spherical
beads, at least some changes in the magnitude of the protective effect afforded by albumin can be attributed to changes in properties of turbulent flows in the bead’s wake [7].
Furthermore, use of a cylindrical (rather than spher-ical) bead introduces additional stresses, beyond those of the bead’s turbulent wake, associated with the bead’s annulus (which is notably minimal in the case of a spherical bead). Those would be related both to the flow through the annulus and to the increased oppor-tunity of cell interaction with the bead’s annular sur-face. (Note that in the configuration here, the interac-tion with the bead’s surface is of primary relevance, as the medium remains largely stationary relative to the enclosing tube’s wall). Such stresses can, as was shown previously [8], and as confirmed in this work, significant-ly modify magnitudes both of induced hemolysis and of the protection from it due to media supplementation with albumin.
Bead considerations
The dependence of induced hemolysis on bead ge-ometry was complicated, and at least in part was found to depend on bead speed. Bead movement within the tube and through the medium is determined through the interplay of flow drag and flow resistance forces, combined with the effect of gravity and with direct bead impact with the oscillating tube (within the bead mill head or tube-holder). Over each oscillation period, bead
speed and thus flow speed around the bead would be continuously changing, with the speed distribution as for example shown on inserts in Figure 3, Figure 5 and Figure 6. Thus, over each oscillation period, RBC would be subject to changing levels of mechanical stress. In the present work,we directly determined the bead speed throughout oscillations (via video) and attempted to represent the impact of speed through average speed values. Such approach has clear limitations, and future attempts of linking induced hemolysis directly with dis-tribution profiles could potentially provide additional insight into mechanisms of cell damage.
There is a striking similarity between the induced hemolysis and average bead speed dependencies on bead length (Figure 1 and Figure 3). For RBL/TL < 0.6, the increase in bead speed with increased bead length is likely due to the progressively increasing bead weight (per Figure 6), even though offset by the increased flow resistance, which likely increases linearly with the length of a bead. It should be noted, that the dependence of bead speed on its length, and the dependence of resultant hemolysis on bead’s length, are not a simple (linear) function of the weight and the length of a bead. Normalization for these parameters (assuming linear dependence) does not produce a uniform (per unit of weight and/or length) hemolysis (data not shown). That implies either a higher order function of weight/length dependence or a more complex dependence, which could involve other (e.g., medium related) parameters changing along with (for example) the bead’s length change.
For RBL/TL < 0.6,the bead’s speed and the associated hemolysis decline is likely due to bead movement being constrained by the length of the tube, which imposed a limit on how far a bead may travel during each oscil-lation. That is supported by the pattern of bead move-ment recorded by high-speed camera, which shows that for beads 20 mm and longer, the bead oscillates between the ends of the tube with the frequency of the tube oscillation (Figure 2). (Note that this was not the case for shorter beads, which exhibited a random-move-ment behavior, rarely reaching the ends of the tube, as demonstrated by the ranges of bead movement). Thus, constrained by the tube, longer beads would not be able to reach velocities that would be otherwise expected, with bead velocity approaching zero when RBL/TL is ap-proaching 1. Note that for some bead and tube geome-tries as well as stress application parameters (e.g. oscil-lation frequency and intensity), increasing the length of the cylindrical bead could result in decreased speed of the bead’s movement in the tube (possibly due toa low-er final speed for each oscillation, which in turn may be a function of decreased opportunity for acceleration). This could lead to a more complex manifestation of al-bumin’s protective effect (e.g. a decrease in the effect followed by an increase) with increasing bead length, reflecting changes in the overall composition of me-
chanical stress types being applied to RBC. Such com-plex dependencies still require further investigation.
Average velocities of movement through the media were similar between short (6-7 mm in length) cylindri-cal beads and a spherical bead of comparable diameter (7 mm), implying potentially similar wake turbulence and thus hemolysis associated with wake turbulence. For such beads overall hemolysis magnitudes were in-deed comparable in non-supplemented AS3, but not in albumin supplemented media (Figure 1). The results suggest the existence of at least two hemolysis inducing effects that depend on bead length: One for which al-bumin makes cells more susceptible to hemolysis, and another, where,with increased bead length, albumin provides progressively greater protection against he-molysis - supporting conclusions drawn previously [8].
Flow considerations
With just spherical beads, it had been demonstrated that effectiveness of protection against hemolysis, pro-vided by albumin, depends on the speed of the bead, possibly due a transition of Von Karman trail to a pro-gressively more disorganized wake [7]. The scale of pro-tection against shear stress, and thus cell hemolysis, can be evaluated using an albumin protection coefficient, 33minmin3ASAS AlbuAlbuASHemHemKHem-= where 3ASHemis induced hemolysis in non-supplemented media and 3minAS AlbuHem is hemolysis in media supplemented with albumin. In that study, the changes of average bead speed from 450 to 1,300 mm/s mm per sec was associated with a 50 percent increase in KAlbumin. (There, the changes in bead speed were the result of changes in oscillation frequency between 20 and 50 Hz).
However, as shown here, for small cylindrical beads KAlbumin is negative, and changes in bead length resulted in much smaller changes in average speed (from ~600 to ~800 mm/s); however, it was associated with much more pronounced changes in KAlbumin, from negative 27 percent for a 6 mm long bead to about + 95 percent for a 20 mm long bead. These observations indicate that speed-associated changes in wake turbulence are unlikely to drive bead-length related changes in how albumin supplementation affects hemolysis.
t is more likely that such effects are associated with the annulus - e.g., a bulk annulus flow stress (possibly with increased flow laminarity due to turbulence sup-pression [12]), combined with stress due to RBC interac-tion with the bead annulus surface (possibly similar to a phenomenon discussed previously [13]).
The speed of the annular flow (medium flow relative to the bead’s surface) depends on the speed of the bead itself and on the ratio of cross-sections of the tube and the bead. At constant bead diameter (if only the bead length is changing between tests this ratio remains
constant, making the speed of annulus flow linearly dependent on the bead’s speed, with faster annular flow for faster moving beads. That is no longer true when the diameter of the bead is no longer constant between beads. For beads used in this work, an increase in diameter, and thus in RBD/TD, resulted in progressive linear decrease in measured bead speed (Figure 5). However, the speed of annulus flow would increase nearly exponentially with an associated decrease in annular opening cross-section. Note that while bead weight by itself would be positively correlated with bead speed, in this case, this effect is apparently secondary to a concurrently increasing flow resistance due to increase in bead diameter and smaller annular opening.
Thus, initial decline in the magnitude of induced he-molysis with increase in bead diameter (up to RBD/TB = 0.8) would most likely be associated with a decline in wake turbulence due to decreasing speed of the bead. Follow up increase in induced hemolysis could be due to exponential increase in annular flow rate and associat-ed annulus-related stresses. That implies a marked shift in relative contributions of the stresses with the chang-es in bead diameter, and in the resultant contribution of annulus-associated stresses to overall cell hemolysis.
RBC response to mechanical stress had been previ-ously evaluated using a variety of methods, including capillary or tube flow, jets, rotational disks and concen-tric cylinders, cone and plate arrangements, and bead(s) oscillation or agitation [11,14-19]. Hemolysis was ob-served both in-bulk (including cell-cell and direct shear) and at solid surface and air interfaces (e.g. [20-22]), with the material of the blood-contacting surface potentially able to influence RBC damage (e.g. [13,23]). Both lam-inar and turbulent flows had been implicated in cell fragmentation with different hemolytic thresholds and mechanisms of flow-induced hemolysis [15,22,24]. In laminar flows, the stress across the membrane would be determined by the flow around the cell and relate to velocity gradient and fluid viscosity. In turbulent flow, additional stress would relate to chaotic eddy motion, when Kolmogorov scale approaches the scale of RBC. There the stress would depend on the actual properties of the turbulence, with large eddies transporting cells and resulting in low stress gradient across the cell, and thus low actual stress on the cell membrane. Small (com-pared to the cell size) eddies could, on the other hand, create large velocity gradients across the membrane, resulting in significant stress. Thus, it was suggested that cell damage in turbulent flow arises only through eddies comparable to cell size (described through the Kolmogorov length scale) [25,26]. Such effects cannot be predicted from Reynolds stress alone, as Reynolds stress does not account for potential variability in scale sizes.
Experimentally, in-bulk hemolysis would have two main determinants: Shear stress intensity/level and
exposure time. Cells can, for a short time, withstand very high stress, with prolonged exposure leading to hemolysis at a much lower stress levels, and no hemolysis occurring below a certain, even lower, stress threshold [20,27,28]. RBC ability to withstand applied mechanical stress was also shown to be markedly affected by cell environment [7,10]. Overall, the relative contribution of factors leading to stress-induced hemolysis would vary between various experimental setups and regimes of testing, with each case potentially giving predominance to a unique combination of factors.
Depending on the type of flow and the shear rate, RBC can exhibit a variety of dynamic states including rolling, tumbling and Fies by-like swinging [29]. Chaotic motion is also possible especially in a turbulent flow. Commonly described is a “tank treading”, which portrays a tank-thread-like rotation of the cell membrane around the cytoplasm. Incidentally, tank treading had been shown to result in a RBC concentration gradient, with cells disproportionally concentrated towards the center of the blood vessel [30]. (Such could conceivably occur within the bead’s annulus in the case of a sufficiently laminar flow).
The type of impact due to the flow can potentially be described through Reynolds numbers, which for oscillating beads, would likewise oscillate, due to the constantly changing speed of the bead and thus of the flow over the bead. Moreover, for cylindrical beads, flow dynamics and Reynolds numbers would be expected to differ between bead wake and annulus flow.
For cylindrical beads of given diameters, a change in a bead’s length would impact Reynolds numbers for both wake and annulus flows, as both would be primarily impacted by the changes in bead speed. Accordingly, in both cases, estimated R values were highest for 18-20 mm beads and lowest for the 29 mm bead (Table 1). For the geometry used in this work, average Re values for annular flow would be lower than for the wake flow, as increased flow speed through the annulus is compensat-ed by the decrease in the hydraulic diameter. Supple-mentation with albumin resulted in increased density and dynamic viscosity of the medium, and associated reduction in bead speed, with overall lower Reynolds numbers for both wake and annulus flows (Table 1). (It should be noted that while average Re values allow for an approximate analysis, the effective Re values deter-mining the composition of flow type, and thus of relat-ed shear stress, would fluctuate from zero up to their maximum values (up to 3-fold for non-supplemented, and up to 5-fold on average for albumin supplemented medium). The impact on induced stress is likely further accentuated by the stochastic nature of turbulence in general).
Although change in length for beads of a given diameter resulted in coordinated increase and decline of Re associated with wake and annulus flows, change
Table 1: Reynolds Number values for bead wake and annulus flow in Additive Solution 3 media non-supplemented (AS3) and supplemented (AS3-BSA) with 4 g/dL bovine serum albumin.
| Bead dimensions | Average Re, 103 | |||||
|---|---|---|---|---|---|---|
| Diameter, mm X Length, mm | Bead wake | Bead annulus | ||||
| AS3 | AS3-BSA | AS3 | AS3-BSA | |||
| VVariable length (conditions as in Figure 1 | ||||||
| 7 × 6 | 2.4 | 2.3 | 1.1 | 1.0 | ||
| 7 × 18 | 3.4 | 2.4 | 1.5 | 0.9 | ||
| 7 × 29 | 1.8 | 1.9 | 0.8 | 0.9 | ||
| Variable diameter (conditions as in Figure 4 | ||||||
| 5.5 × 18 | 4.8 | 2.8 | 1.9 | 0.7 | ||
| 7 × 18 | 3.3 | 2.3 | 3.8 | 1.6 | ||
| 8 × 18 | 2.3 | 1.6 | 9.8 | 4.0 | ||
in diameter at a given length gave rise to divergent Re changes (Table 1). Oscillations of larger diameter beads were associated with wake flows having smaller Re values, and with larger Re values for annulus flows.
For flow in the bead wake, Reynold numbers’ values would suggest a predominantly turbulent vortex street similar to that suggested previously for spherical beads [7]. The annular flow, however, would also depend on bead and tube dimensions, oscillation frequency and force, and sample media/environment. Notably, for the annulus, the geometry with flow-confining walls, which stiffens the flow, could be expected to increase the threshold Re value for laminar-to-turbulent flow transition. Thus, while for certain bead dimensions (at least for the overall stressing configuration/parameters used here) turbulent flows would be expected, for other bead dimensions turbulent conditions become less favorable, with a substantial part of the flow over time likely occurring in or close to a laminar fashion. Such effect could be further accentuated in albumin-supplemented media.
Limitations
Although the current work is experimentally based, with inferences being drawn largely from such results, some of the interpretations naturally draw upon fluid dynamics principles. Models based on Reynolds stress evaluation had been extensively used to characterize tur-bulence and associated blood damage (e.g. [25,31,32]). However, such models do not account for actual turbu-lence structure and cell microenvironment, and thus cannot fully characterize the stresses that would impact any particular red cell. It had been shown that at least in some cases, predictions based purely upon Reynolds based stresses are inadequate in accounting for actual blood damage in turbulent flows (e.g. [28,33]). Similarly, models based upon evaluation of turbulent eddy length scales also had been shown to be a poor predictor of flow-induced RBC damage [34]. Such reports showcase the difficulties in predicting flow-induced hemolysis,
for which analysis (as mentioned above) can be further complicated by cell interaction with (for example) blood proteins and biological or artificial surfaces.
Other limitations include the specific bead milling configuration employed here for MF testing, which al-though providing multiple variable testing parameters, may not reflect all conceivable physiologically relevant stressing variations. Further study with additional alter-native bead/tube geometries and combinations, among other differences such as in the oscillation characteris-tics, could help to further elucidate the effects and in-terplay of the induced flows and stresses involved, as well as offer other opportunities to investigate potential clinical correlations. That, in turn, could better inform testing configurations, settings, and/or protocols.
Conclusions
RBC MF profiling can present a useful tool in ex-ploring various aspects of RBC health or membrane damage, and this is particularly true when the testing allows varying stress types and magnitudes applied to the cells. Different causes of induced hemolysis, and of sub-hemolytic damage, vary considerably (e.g., due to blood storage, effects of drugs, extracorporeal pro-cessing, non-biological surfaces, mechanical impact of artificial valves or ventricular assist devices) and would likely be associated with different types of damage to cell membrane structures. Thus, optimal probing of such damage in RBC samples via MF testing would likely require application of stress(es) tailored to substantially target affected membrane structures of interest for giv-en clinical applications (upon validation for such respec-tive applications). Use of oscillating beads of different possible sizes and shapes, particularly in a bead milling configuration having other variable testing parameters, can offer users a means to control induced stresses both qualitatively as well as quantitatively.
Acknowledgements
The authors thank Kenneth Alfano for relevant dis-
cussion and manuscript review, and gratefully acknowl-edge Stephen Hampel for providing technical assistance including precision machining of certain components employed in the work.
Interest disclosure
The authors have been employed with Blaze Medi-cal Devices, and authors Tarasev and Chakraborty own equity in Blaze Medical Devices. Blaze Medical Devices is a company that has developed technology relating to bead mills and bead milling based profiling of mechan-ical fragility (MF) of red blood cells (RBC). The Blaze technology has since been licensed out to Functional Fluidics.
References
- Chasis JA, Schrier SL (1989) Membrane deformability and the capacity for shape change in the erythrocyte. Blood 74: 2562-2568
- Gladwin MT, Kanias T, Kim-Shapiro DB (2012) Hemolysis and cell-free hemoglobin drive an intrinsic mechanism for human disease. J Clin Invest 122: 1205-1208.
- Mosior M (1988) Elastic properties of the erythrocyte membrane and the critical cell volume of erythrocytes. Biochim Biophys Acta 946: 429-430
- Olia SE, Maul TM, Antaki JF, Kameneva MV (2016) Mechanical blood trauma in assisted circulation: Sublethal RBC damage preceding hemolysis. Int J Artif Organs 39: 150-159.
- Kameneva MV, Antaki JF, Konishi H, Whalen JJ, Kerrigan JP, et al. (1994) Effect of perfluorochemical emulsion on blood trauma and hemorheology. ASAIO J 40: M576-M579.
- Tarasev M, Alfano K, Chakraborty S, Bertholf M, Zubair A (2013) Mechanical fragility as a potential time-independent measure of membrane integrity among stored RBC Units. J Blood Disord Transfus 4: 139.
- Tarasev M, Chakraborty S, Light L, Davenport R (2016) Impact of environment on Red Blood Cell ability to withstand mechanical stress. Clin Hemorheol Microcirc 64: 21-33.
- Alfano KM, Chakraborty S, Tarasev M (2016) Differences in bead-milling-induced hemolysis of red blood cells due to shape and size of oscillating bead. Biomed Mater Eng 27: 405-412.
- Levitt J (2014) Standards for Blood Banks and Transfusion Services. (29th edn), AABB, Bethesda, MD.
- Kameneva MV, Antaki JF, Yeleswarapu KK, Watach MJ, Griffith BP, et al. (1997) Plasma protective effect on red blood cells exposed to mechanical stress. ASAIO J 43: M571-M575.
- Indeglia RA, Shea MA, Forstrom R, Bernstein EF (1968) Influence of mechanical factors on erythrocyte sublethal damage. Trans Am Soc Artif Intern Organs 14: 264-272.
- Charles ME (1963) The pipeline flow of capsules: Part 2: Theoretical analysis of the concentric flow of cylindrical forms. The Canadian Journal of Chemical Engineering 41: 46-51.
- Offeman RD, Williams MC (1979) Material effects in shear-induced hemolysis. Biomater Med Devices Artif Organs 7: 359-391.
- Gu L, Smith WA, Chatzimavroudis GP (2005) Mechanical fragility calibration of red blood cells. ASAIO J 51: 194-201.
- Kameneva MV, Burgreen GW, Kono K, Repko B, Antaki JF, et al. Int J Blood Res Disord 2019, 6:041• Page 12 of 14 •et al. (2004) Effects of turbulent stresses upon mechanical hemolysis: Experimental and computational analysis.
- Nakahara T, Yoshida F (1986) Mechanical effects on rates of hemolysis. J Biomed Mater Res 20: 363-374.
- Butler T, Bradley CA, Owensby JE (1992) Plasma components protect erythrocytes against experimental haemolysis caused by mechanical trauma and by hypotonicity. Int J Exp Pathol 73: 27-33.
- Raval JS, Waters JH, Seltsam A, Scharberg EA, Richter E, et al. (2010) The use of the mechanical fragility test in evaluating sublethal RBC injury during storage. Vox Sang 99: 325-331.
- Alfano KM, Tarasev M, Meines S, Parunak G (2016) An approach to measuring RBC haemolysis and profiling RBC mechanical fragility. J Med Eng Technol 40: 162-171.
- Leverett LB, Hellums JD, Alfrey CP, Lynch EC (1972) Red blood cell damage by shear stress. Biophys J 12: 257-273.
- Beissinger RL, Laugel JF (1987) Low-stress hemolysis in laminar blood flow: Bulk and surface effects in capillaries. AIChE Journal 33: 99-108.
- Sutera SP (1977) Flow-induced trauma to blood cells. Circ Res 41: 2-8.
- Monroe JM, True DE, Williams MC (1981) Surface roughness and edge geometries in hemolysis with rotating disk flow. J Biomed Mater Res 15: 923-939.
- Yen JH, Chen SF, Chern MK, Lu PC (2014) The effect of turbulent viscous shear stress on red blood cell hemolysis. J Artif Organs 17: 178-185.
- Liu JS, Lu PC, Chu SH (2000) Turbulence characteristics downstream of bileaflet aortic valve prostheses. J Biomech Eng 122: 118-124.
- Lu PC, Lai HC, Liu JS (2001) A reevaluation and discussion on the threshold limit for hemolysis in a turbulent shear flow. J Biomech 34: 1361-1364.
- Bernstein EF, Blackshear PL Jr, Keller KH (1967) Factors influencing erythrocyte destruction in artificial organs. Am J Surg 114: 126-138.
- Quinlan NJ, Dooley PN (2007) Models of flow-induced loading on blood cells in laminar and turbulent flow, with application to cardiovascular device flow. Ann Biomed Eng 35: 1347-1356.
- Dupire J, Socol M, Viallat A (2012) Full dynamics of a red blood cell in shear flow. Proc Natl Acad Sci U S A 109: 20808-20813.
- Basu H, Dharmadhikari AK, Dharmadhikari JA, Sharma S, Mathur D (2011) Tank treading of optically trapped red blood cells in shear flow. Biophys J 101: 1604-1612.
- Giersiepen M, Krause U, Knott E, Reul H, Rau G (1989) Velocity and shear stress distribution downstream of mechanical heart valves in pulsatile flow. Int J Artif Organs 12: 261-269.
- Grigioni M, Caprari P, Tarzia A, D’Avenio G (2005) Prosthetic heart valves’ mechanical loading of red blood cells in patients with hereditary membrane defects. J Biomech 38: 1557-1565.
- Ge L, Dasi LP, Sotiropoulos F, Yoganathan AP (2008) Characterization of hemodynamic forces induced by mechanical heart valves: Reynolds vs. viscous Stresses. Ann Biomed Eng 36: 276-297.
- Dooley PN, Quinlan NJ (2009) Effect of eddy length scale on mechanical loading of blood cells in turbulent flow. Ann Biomed Eng 37: 2449-2458.
Supplement with Additional Materials and Methods for:
c“Impact of the Oscillating Bead Size and Shape on Induced Mechanical Stress on Red Blood Cells and Associated Hemolysis in Bead Milling” (by Michael Tarasev, Marina Muchnik, and Sumita Chakraborty).
Materials and Methods
RBC fragility test
Samples of RBC were diluted to total hemoglobin (Hb) concentration of 1.2 g/dl, corresponding to about 3.5% hematocrit, verified by a Hemoglobin 201 system from HemoCue (Angelholm, Sweden), with AS3 storage buffer, pH 5.8, containing at times additives - as speci-fied in the text. The diluted sample was gently agitated and aliquoted into 2 ml low-retention centrifuge tubes. For each experiment, the volume of this aliquot (rang-ing from 350 μL to 1 mL) was selected to ensure mea-surable hemolysis at the widest range of experimental variables (e.g. different bead lengths or diameters), as lower volumes result in faster and stronger hemoly-sis while larger volumes result in slower and less pro-nounced hemolysis. Mechanical stress was applied to RBC samples with the use of a Tissue Lyser LT (Qiagen, Dusseldorf, Germany) vertical bead mill, in the presence of one spherical bead or one longitudinally oriented cy-lindrical bead (as specified). Cylindrical beads were cus-tom machined to required dimensions. Samples from each RBC unit were subjected to such stress at 10 dif-ferent durations (ranging from 30 seconds to 30 min) to ensure a wide range of induced hemolysis levels - for a fragility “profile”. The sample tube holder of the Tissue Lyser was modified to allow aircooling while in opera-tion, which resulted in sample temperature stabilization to within 2 degrees of the start temperature. Un-lysed cells were precipitated by centrifuging the samples for 5 minutes at 1,300 rpm on an Eppendorf 5417C centri-fuge (Hauppauge, NY). Aliquots of supernatant were collected, and their spectra recorded. All tests were performed at 6 °C, in AS3 storage buffer, pH 5.8, unless indicated otherwise. Such conditions were selected to mimic that of packed RBC storage with AS3, commonly used storage solution, with its low pH value aimed to suppress cell metabolism. Figures present representa-tive results obtained for a given RBC sample, with error bars (± SD) indicating experimental error on three inde-pendent measurements for that value.
RBC hemolysis assessment
Hemolysis (Hem), both as present in untreated sam-ple (“autolysis”) and as induced by the bead mill in fra-gility testing, was determined based on the difference in absorbance at 576 nm, a wavelength of oxygenated Hb maximum, and absorbance at 685 nm, the local min-imum for the oxygenated Hb form. It was expressed as a fraction of free hemoglobin (HBF) relative to total he-
moglobin concentration (HbT) according to Formula 1 which included the correction for sample hematocrit as detailed by Sowemino-Coker [1].576685576685* (1)FFTTHbHbHemHematocritHbHb-=-- (Formula 1)Total hemoglobin concentration for each diluted RBC sample was determined by subjecting a small (350-400 μL) aliquot to ultrasound for 40 seconds (0.1 sec-ond pulses, with 0.2 intervals between pulses, on ice) delivered by a Branson Digital Sonifier 450 (Danbury, CT), at 15% intensity (from the manufacturer specified 400 Watt). In control experiments, such treatment was shown to fully lyse RBC without inducing hemoglobin ox-idation. For determining auto-hemolysis (i.e., hemolysis prior to any application of mechanical stress), small (30 μl) aliquots of undiluted samples were centrifuged for 5 min at 1,300 rpm, supernatants were collected, and he-moglobin content was measured spectrophotometrical-ly. Spectroscopic measurements were performed with a NanoDrop N100 spectrophotometer (Thermo Scientific, Waltham, MA).
RBC fragility profiles
RBC Mechanical Fragility (MF) profiles are defined here as the data points representing incremental (amount exceeding auto-hemolysis) hemolysis in a sample re-sulting from applied mechanical stress at multiple time points of a progressively increasing cumulative duration. The same sample could be used for successive stressing between hemolysis measurements, or, respective sub-samples could be used for each target duration over the range; the latter was done here. (Such profiling also can optionally be performed at different stress intensities, e.g. with parallel subsamples, for multidimensional pro-filing). Unlike single-point MF measurements that use a single total stress duration at a single stress intensity (as implemented for example by Raval, et al. e.g. [2]), MF profiles allow recording of a RBC sample’s propensity to hemolyze over a range of applied stress magnitudes (e.g., from that resulting in minimal lysis up to that re-sulting in nearly total hemolysis in the tested sample). Such profiles give more information on lysis propensity for a population (or sometimes discernable subpopula-tions) of cells in a sample, and can allow selecting or cal-culating of various possible fragility-based index values (e.g. interpolated or otherwise derived) for separate analyses. Area Under the Curve (AUC), representing the area under the collected fragility profile, is a pro-file-based value that was used here to evaluate induced hemolysis over a given aggregate stress duration.
Other
Stainlesssteel cylindrical beads were custom made, with weight adjustments achieved, when desired, by creating variable-size hollows inside the beads by boring a bead to a predefined wall thickness and then closing the opening with a tight-fitting insert.
Data is presented in the form of sample mean and standard deviation (SD), the median, with 1.5 x IQR (interquartile range) where appropriate. One sample Student t-test or signed rank test with a two-tailed p-value of 0.05 was used to test for statistical significance. Fits shown on the figures are for illustration purposes only.
References
- Sowemimo-Coker SO (2002) Red blood cell hemolysis during processing. Transfus Med Rev 16: 46-60.
- Raval JS, Waters JH, Seltsam A, Scharberg EA, Richter E, et al. (2010) The use of the mechanical fragility test in evaluating sublethal RBC injury during storage. Vox Sang 99: 325-331.