Data Analysis
In the present method, the percentage of hemolysis present is determined by exploiting the ‘‘flattening’’ effect of absorbance spectra in the 390–460nm range (due to non-homogeneity of RBC samples, as previously described.[16,17]). For a sub-millimeter-thick intrinsically non-homogeneous RBC sample, spectrum- flattening effects would be very pronounced in the high-absorbing Soret region, without affecting lower absorbance in the VIS spectral range. Thus, the composite spectrum of partially haemolysed blood would in the near-UV range present an ‘‘apparent’’ Soret band combining a flattened spectrum for the Hb within cells and a non-flattened spectrum for the extracellular or cell-free Hb and in the VIS range present a spectrum for the combined non-flattened absorbance of the total Hb in the sample. The flattened Hb spectrum in the near-UV region at the Soret band can then be contrasted with the non-perturbed spectrum in the visible region. At different levels of hemolysis and, thus, different relative fractions of cell-free Hb, there would be changes to the ratio between the apparent Soret peak and the visible spectrum band’s maxima. Those would be proportional to the cell-free Hb fraction (see Figure 2), which, compared to total Hb concentration (measured independently or at 100% hemolysis), would determine the fraction of haemolysed cells.
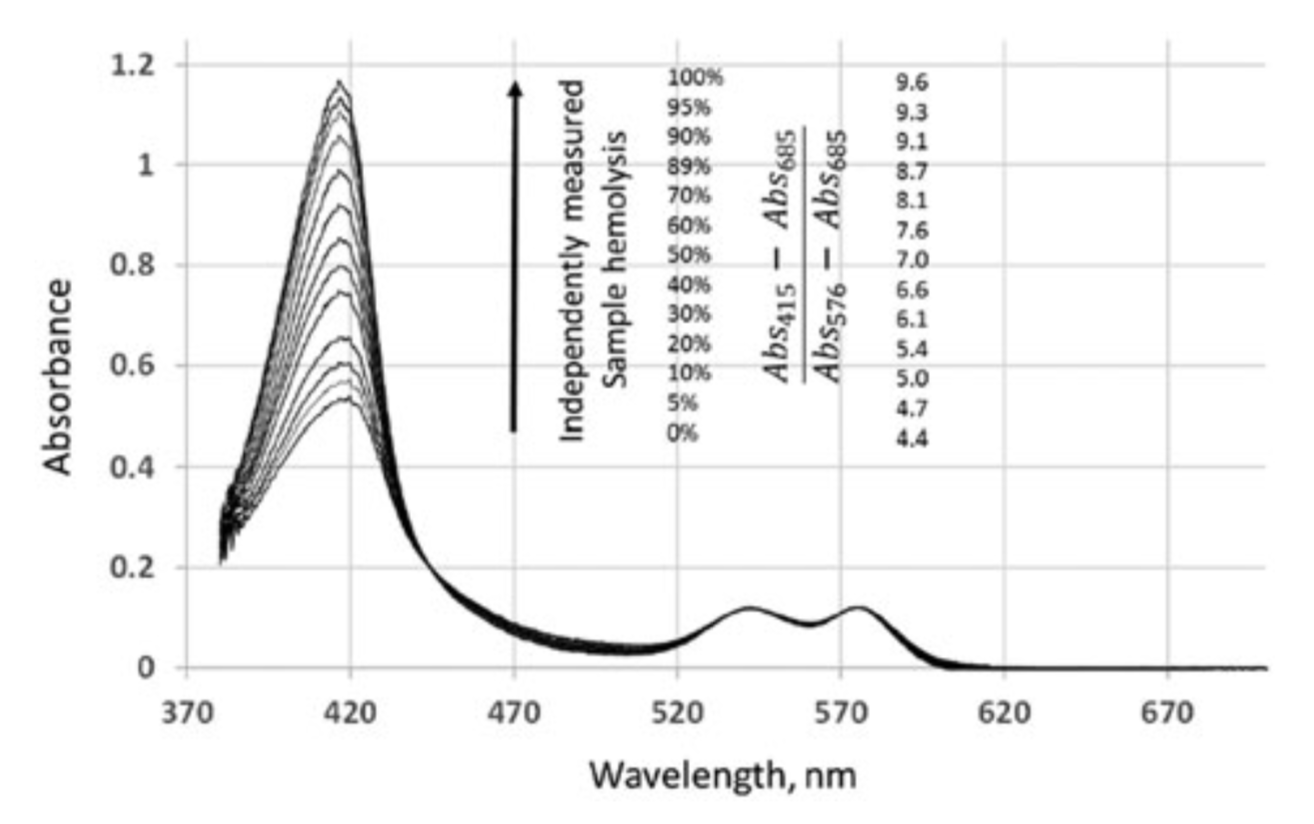
Changes in the absorption spectrum of an RBC sample upon hemolysis. RBC were diluted to 0.5g dL 1 haemoglobin ( 1.5% haematocrit) concentration with AS3 blood storage solution. Samples of leuko-reduced packed RBC in AS3 storage solution, typically 15–20g dl 1 Hb, was received from the University of Michigan Hospital Blood Bank and were used prior to expiration. Initial total hemoglobin concentration and, thus, hematocrit, was determined using the HemoCue 201 system, with successive changes due to progressive hemolysis estimated through iterative extrapolation based on previous hematocrit level (although high dilution reduces the impact of the correction). Presented are spectra (corresponding (A415–A685)/ (A576–A685) ratios) after the baseline correction with absorption at 685nm taken as zero and with absorbance at 576nm
thus, different relative fractions of cell-free Hb, there would be changes to the ratio between the apparent Soret peak and the visible spectrum band’s maxima. Those would be proportional to the cell-free Hb fraction (see Figure 2), which, compared to total Hb concentration (measured independently or at 100% hemolysis), would determine the fraction of haemolysed cells.
The light source utilises a 420nm and a 5500 K white LED, with the 420nm LED (405–435nm range) providing sufficient illumination at 415nm, the wavelength of an oxygenated haemoglobin (oxyHb) Soret band maximum and the white LED suitable for detection absorbance at 576 nm (a visible-range oxyHb maximum) and 685nm (an oxyHb absorbance minimum, used as a baseline reference point). The Ocean Optics USB spectrophotometer with a 10lm slit provides spectral selectivity to within 1nm in the 200–800nm spectral range. Figure 3 illustrates the current accuracy of the present optical approach, which allows a measurement to be performed without sample separation, as compared to a conventional optical technique based on supernatant analysis following centrifugation to separate the sample. The percentage of induced hemolysis in the sample is highly correlated with the